8.2 Gather
library(ggplot2)

ggplot(table4a_tidy) +
    geom_histogram(aes(x = cases, fill = country))
## `stat_bin()` using `bins = 30`. Pick better value with `binwidth`.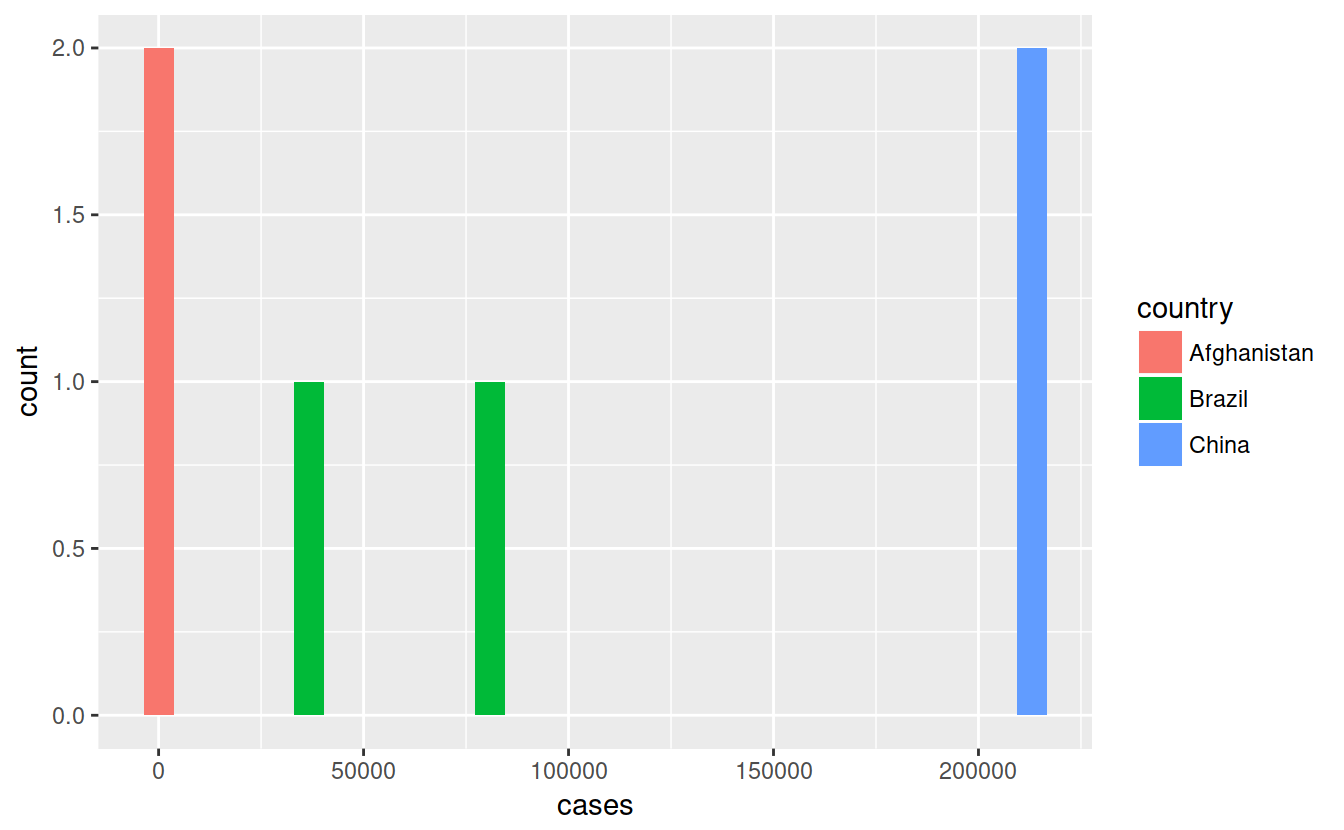
(table4a_tidy <- table4a %>%
    gather('2000', '1999', key = "year", value = 'cases'))
## # A tibble: 6 x 3
##   country     year   cases
##   <chr>       <chr>  <int>
## 1 Afghanistan 2000    2666
## 2 Brazil      2000   80488
## 3 China       2000  213766
## 4 Afghanistan 1999     745
## 5 Brazil      1999   37737
## 6 China 1999 212258library(magrittr) # this is what actuallly gives you the pipe
##
## Attaching package: 'magrittr'
## The following object is masked from 'package:tidyr':
##
## extract(table4b_tidy <- table4b %>%
gather('1999':'2000', key = 'year', value = 'population'))
## # A tibble: 6 x 3
## country year population
## <chr> <chr> <int>
## 1 Afghanistan 1999 19987071
## 2 Brazil 1999 172006362
## 3 China 1999 1272915272
## 4 Afghanistan 2000 20595360
## 5 Brazil 2000 174504898
## 6 China 2000 1280428583